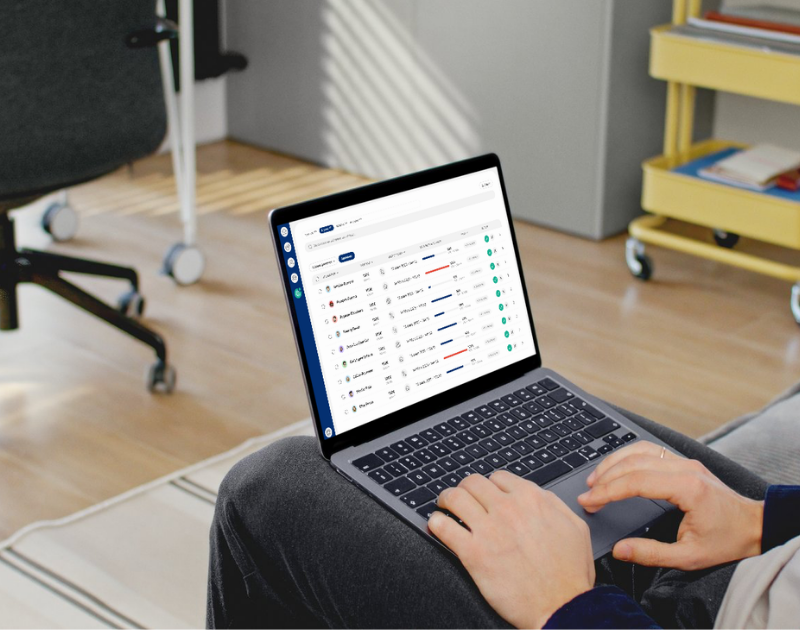



Waiting until the end-of-year report to analyze your electric fleet's performance often means discovering issues too late that could have been corrected as early as September. A mid-year review, at a time when fleet team activity typically slows down, allows you to adjust your strategy before budget decisions are finalized for the fall. We previously laid the groundwork for this management approach in our article Fleet Management 2026: The 5 Essential KPIs to Track ; here is how to put them to work at this specific time of year.
An end-of-year report almost always arrives too late to influence the current fiscal year: budgets are already committed, contracts are signed, and there is little room for maneuver.
Conversely, a review in July or August leaves several months to correct your trajectory before the year closes, while still relying on data that is sufficiently robust to be meaningful.
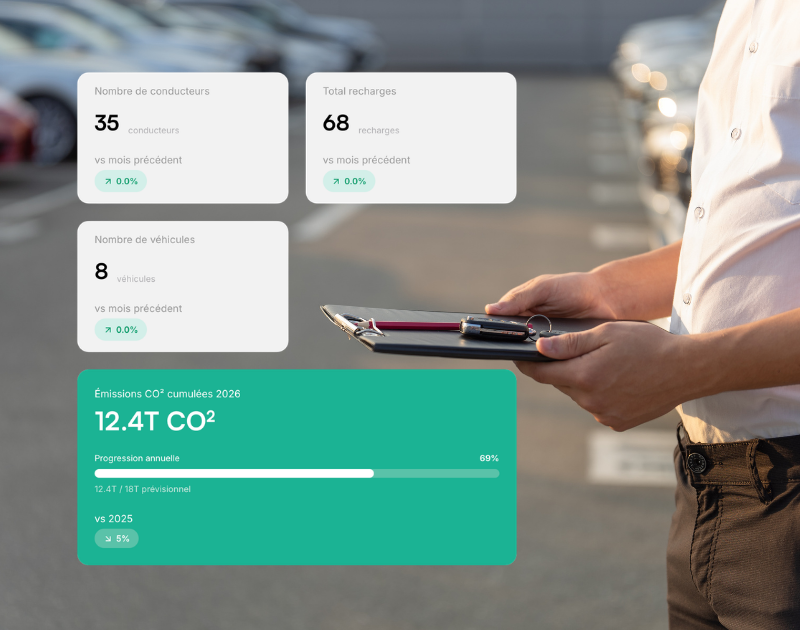
This first indicator reveals whether your fleet's electric vehicles are truly being used to their full potential, or if some remain underutilized due to a mismatch with the actual needs of the employees involved.
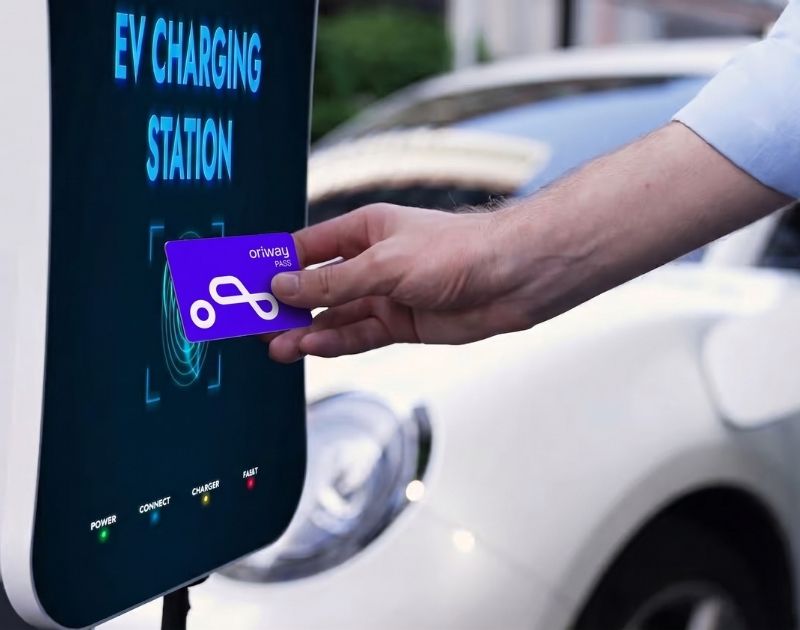
This is often the most telling indicator: by comparing the average cost of charging at home, on-site, and on the road, you can quickly identify where avoidable extra costs are concentrated.
If some employees regularly report difficulties accessing a charging station, this rate helps to objectify the problem—a particularly sensitive issue during peak summer travel periods, as we detail in our article Summer charging: anticipating your team's business travel.
This KPI allows you to check, mid-year, whether your fleet renewal pace is consistent with your annual electrification goals, particularly in light of your regulatory obligations under the LOM law.
An often overlooked but revealing indicator: an employee who is dissatisfied with their charging experience may adopt behaviors that increase costs, such as avoiding home charging, which is actually more economical.
Once these five indicators have been analyzed, the goal is to prioritize two or three realistic corrective actions before the new season begins.
For example, high roaming charging costs may justify a reminder of best practices for the employees involved.
To learn more about overall fleet financial management, our article Why TCO is dead, long live TCM details how to move beyond simple operational KPI tracking to think in terms of total mobility costs. Additionally, the data from the Enedis study on the profitability, usage, and charging of electric fleets, which we have analyzed in detail, also provides a useful benchmark to compare your own indicators against the market average.
Beyond short-term indicators, a summer review is also the perfect time to incorporate a more structural data point into your management: the actual longevity of your fleet's batteries, which directly determines the residual value of your vehicles and, consequently, your overall TCO.
We explore this issue in detail in our article Heading for 2027: why battery longevity is the cornerstone of your fleet strategy.
Because the cost structure and pain points are different: charging costs vary significantly depending on the location, unlike fuel, which justifies dedicated monitoring.
A quarterly review is a good pace, with at least a mid-year check-in in July or August to adjust your trajectory before the year-end budget closing.
The average charging cost per location is generally the most telling indicator, as it directly reflects behavioral differences between home, on-site, and public charging.